Blast-Plate Interaction
Coupled simulations are validated by recourse to experimental blast loading.
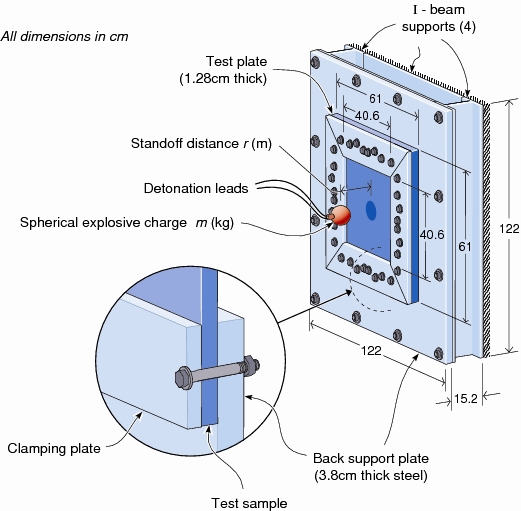
Description of the experimental tests
The tests, which were done at the University of Virgina by Haydn Wadley and Kumar Dharmasena, consist into 150 g of C4 exploding at stand-off distances of 75 and 150 mm from a 1.9mm-thick plate.
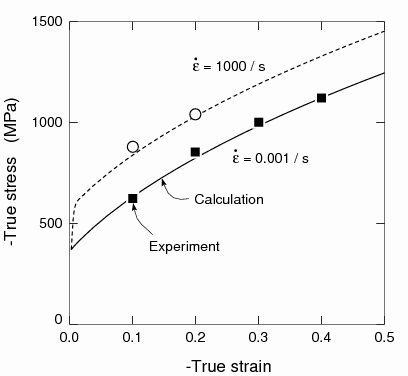
The plates are made of AL6-XN stainless steel, which is modeled by a strain-rate dependant hardening law ![\sigma^y=\sigma^y_0\left[1+\left(\frac{\varepsilon^{\text{pl}}}{\varepsilon_0}\right)^\frac{1}{\eta_\varepsilon}+\left(\frac{\dot{\varepsilon}^{\text{pl}}}{\dot{\varepsilon}_0}\right)^\frac{1}{\eta_\dot{\varepsilon}}\right]](http://vtf.website/asc/wiki/pub/CoupledSimulations/BlastPlateInteraction/57dc76fe68b2bdb3b00e3ee5a899e347.gif) . Parameters are obtained by fitting Nemat-Nasser [JMPS, 2001] results, which leads to
. Parameters are obtained by fitting Nemat-Nasser [JMPS, 2001] results, which leads to
| Mass density | Young modulus | Poisson ratio |  |  |  |  |  |
7880 kg·m | 190 GPa | 0.3 | 365 MPa | 1.19 | 0.136 | 4.82 | 14518 |
Description of the numerical tests
A square plate had a length L = 0.406 m and two different thicknesses: t = 1.9 mm. Perfect clamping of the edges was assumed. These boundary conditions were found to represent the actual supports of the plate in an adequate manner. The computational finite element mesh for the solid plate consists of 29173 elements.
![]()
The Eulerian fluid domain had a prismatic geometry centered with the plate of dimensions 0.6 m x 0.6 m x 0.8 m and is discretized with a base fluid grid of 60 × 60 × 80 cells. In order to capture the shock propagation with sufficient accuracy, an automatic local grid refinement comprising two levels of subdivision was applied on the fluid grid in the cells near the shock front.
The cells near the interface with the solid were also initially refined by one level in order to better resolve the geometry of the solid boundary geometry and the flow field variables adjacent to it.
The blast was initialized by defining a spherical region of diameter d at high pressure  and temperature
  . The explosive charge is located at a distance r from the center of the plate. As illustrated by Brode (1955), in order to reduce the dependency of the solution to the initial temperature of the spherical region, its diameter has to be small compared to the stand-off distance. This justifies the use of diameters d = 0.04 m, leading to densities which are not necessarily in accordance to values of the order of explosive charge. From this diameter, the initial pressure of the pressurized spherical region is directly obtained from
  , while initial density follows directly from
  after a temperature has been arbitrary chosen. E is the energy released, which for the C4 is 5.79 MJ / kg. If this temperature can first appears as a parameter which could influence results, it appears, that its dependence remains small if the stand-off distance is larger than the sphere diameter and if the temperature is higher than the atmospheric one (Brode, 1955). As a first and unique attempt,
  = 20×
= 20× has been used, leading to the set of simulations:
| m of C4 | r | d |  |  |  |
| 150 g | 150 mm | 40 mm | 5860 K | 10.4 GPa | 6220 kg/m |
| 150 g | 75 mm | 40 mm | 5860 K | 10.4 GPa | 6220 kg/m |
Numerical results
A typical stable time step size for the fluid mesh was 0.8µs while that for that for the solid was 0.2µs. Four solid time steps were therefore computed during each fluid time step. The simulations were conducted on a cluster of up to 20 Dual Intel 1.8 GHz Xeon nodes. The processors were apportioned to the fluid and solid solvers according to the expected relative work load. The simulations required between twelve to twenty four hours of computation to advance the simulation by 1ms. The total simulated time ranged from about 3 to 4 ms.
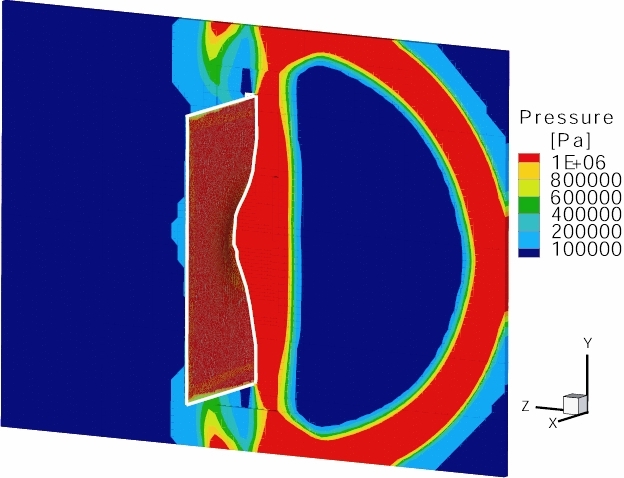
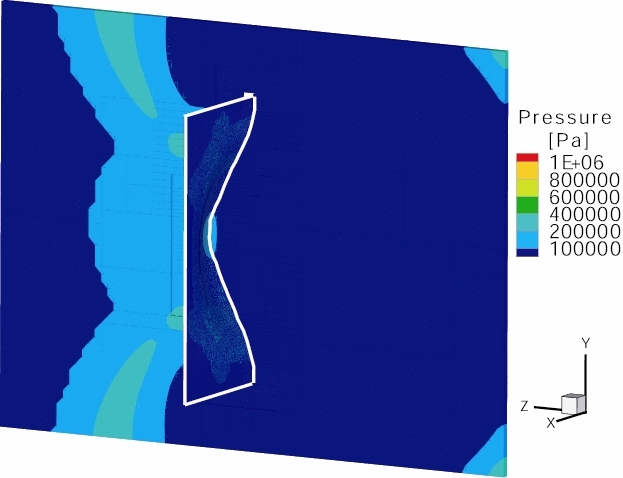
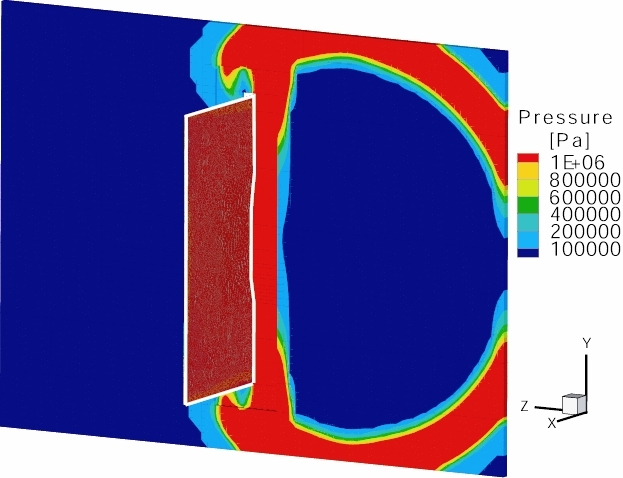
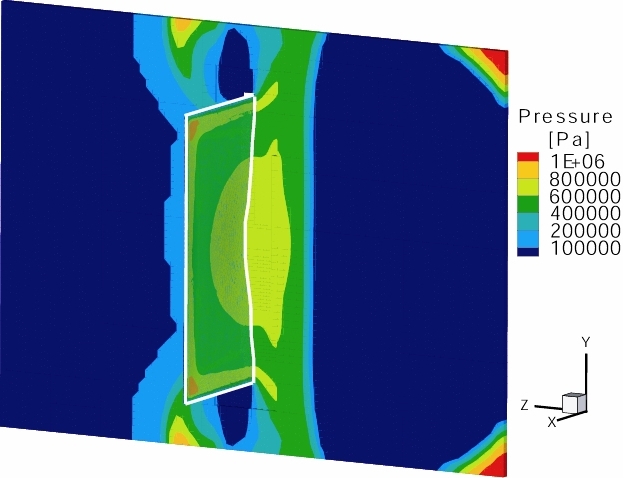
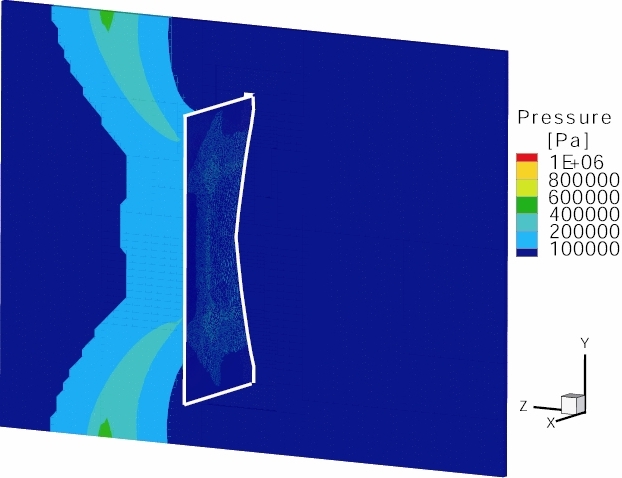
Snapshots of the simulations are illustrated here below:
- Simulation results at t=0.1, 0.2 and 0.3 s and for r=75 mm:
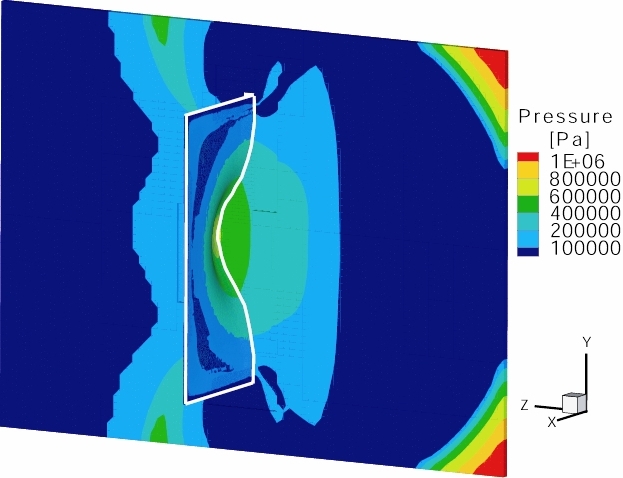
- Simulation results at t=0.1, 0.2 and 0.3 s and for r=150 mm:
Comparison
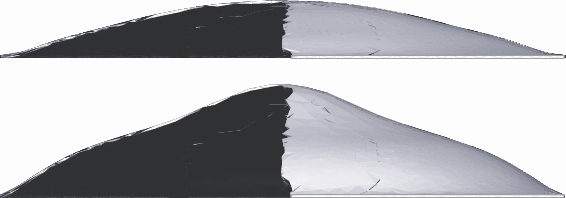
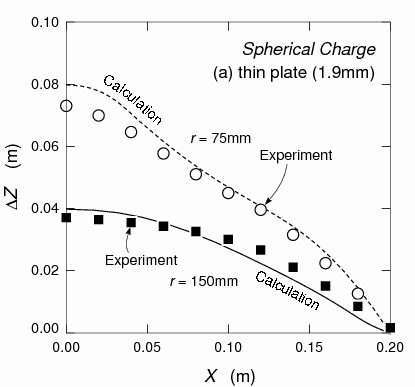
Comparison between the numerical simulations and the experimental is performed by comparing the final deformation of the plates, and it is found that the numerical results are in good agreement with the observed ones.
- Experimental and numerical deformed plates:

- Comparison of the final profiles:
-- LudovicNoels - 09 Jun 2008
| I | Attachment  | Size | Date | Who | Comment |
|---|---|---|---|---|---|
| | testpanel2.eps | 696.6 K | 09 Jun 2008 - 18:33 | LudovicNoels | Description of the experimental tests |
| | COMPLAW.eps | 377.8 K | 09 Jun 2008 - 18:57 | LudovicNoels | Fit of the material law |
| | INICOND2.eps | 16159.6 K | 09 Jun 2008 - 19:27 | LudovicNoels | Model of the numerical simulations |
| | snap-C4-SO7p5-100microBis.eps | 10930.5 K | 09 Jun 2008 - 19:41 | LudovicNoels | Simulation results at t=0.1 s and for r=75 mm |
| | snap-C4-SO7p5-200microBis.eps | 9753.0 K | 09 Jun 2008 - 19:45 | LudovicNoels | Simulation results at t=0.2 s and for r=75 mm |
| | snap-C4-SO7p5-300microBis.eps | 9099.1 K | 09 Jun 2008 - 19:48 | LudovicNoels | Simulation results at t=0.3 s and for r=75 mm |
| | snap-C4-SO15-100microBis.eps | 10115.5 K | 09 Jun 2008 - 19:54 | LudovicNoels | Simulation results at t=0.1 s and for r=150 mm |
| | snap-C4-SO15-200microBis.eps | 9932.5 K | 09 Jun 2008 - 20:04 | LudovicNoels | Simulation results at t=0.2 s and for r=150 mm |
| | snap-C4-SO15-300microBis.eps | 8898.3 K | 09 Jun 2008 - 20:06 | LudovicNoels | Simulation results at t=0.3 s and for r=150 mm |
| | PLATEPEXP2CUT.eps | 2389.3 K | 09 Jun 2008 - 20:17 | LudovicNoels | Experimental deformed plate |
| | PLATEPNUM2CUT.eps | 3193.3 K | 09 Jun 2008 - 20:19 | LudovicNoels | Numerical deformed plate |
| | PLATEP2.eps | 520.3 K | 09 Jun 2008 - 20:23 | LudovicNoels | Comparison of the final profiles |
| | Plate-C4-SO7p5.mpg | 3676.4 K | 09 Jun 2008 - 20:37 | LudovicNoels | Movie of the simulation for r=75mm |